
Comprehensive Solutions for the 30 Major Pain Points in Oil, Gas, and Petrochemicals
Complete English presentation of the source project analysis, preserving the full narrative, tables, figures and evidence boundaries.
Arctic Phoenix Group | Case Study on Integrated Oil, Gas, and Petrochemical Business Transformation
Top 30 Pain Points in Oil, Gas, and Petrochemicals Comprehensive Solutions
Upgrade from dispersed projects, local profits, and static risk control to a unified operational system that integrates trading, physical goods, ownership, risk, and cash flow

Complete Case Report | Oil and Gas Trade × Maritime Energy and Integrated Services × Logistics and Finance
August 2026 | Management Decision and Implementation Blueprint
1. Executive Summary
| Core Conclusion: The 30 pain points are superficially distributed across transactions, ships, ports, warehousing, financing, compliance, and organizational areas. In essence, the issues stem from 'contracts, physical goods, ownership of goods, risks, cash flow, and responsibilities' not following the same transactional thread. The value of a comprehensive solution is not to add another layer of dashboard, but to make every business activity measurable before commitment, visible during execution, reconfigurable in case of anomalies, and accountable after settlement. |
|---|
Case Companies and Transformation Goals
| Dimension | Representative Business Profile | Transformation goal |
|---|---|---|
| Business scale | Annual revenue of approximately $4.8 billion, annual turnover of about 6.2 million tons, approximately 320 core transactions | Increase cash profits and return on capital without blindly expanding scale |
| Business Portfolio | Crude oil/refined oil/chemical products trading, marine fuel and integrated services, cross-border logistics and trade financing | The three major sectors share data, customers, resources, risks, and financial capabilities |
| Operating network | 18 key ports, 12 warehousing/terminal partners, more than 40 core competitors, and several banks | Form end-to-end status, unified evidence, and dynamic limits |
| Current symptoms | Deviation between contracted gross profit and final profit, late discovery of anomalies, deferred capital and risks | Treat final cash profit, RAROC, and complete delivery as common outcomes |
Six Things Recommended for Management Approval
Use a single transaction ID as the common primary key for contracts, logistics, ownership of goods, hedging, credit, financing, costs, and settlement.
Establish six capability domains: transaction profit, resource control tower, risk compliance, ownership financing, customer service, and data and AI.
Acceptance is based on three closed loops: 'from quotation to final profit, from plan to delivery evidence, and from risk to cash recovery'.
First cover the 20% of business links that have high value, high risk, and available data, then replicate across all regions and categories.
The front office, middle office, and back office jointly bear the transaction results; performance shifts from revenue/book gross profit to cash profit and risk-adjusted returns.
AI is used for extraction, prediction, matching, and optimization, and does not automatically trade, release goods, withdraw funds, grant credit, or lift compliance hits.
2. Panorama and Priority of 30 Pain Points
The Impact of 30 Pain Points Across the Three Major Business Segments — Urgency Overview
The source-document visual is presented here as an English-native analytical frame. The adjacent English narrative and tables preserve the full evidence and quantitative context.
Priority assessment is based on five factors: impact amount, tail loss, occurrence frequency, regulatory consequences, and cross-process spread. Red items are given priority to enter the first stage of loss prevention; gold items are implemented along with the integration of master data and processes.
30 Pain Points and Comprehensive Ability Mapping
| Number | Pain point | Primary Responsibility Domain |
|---|---|---|
| Trade 1 | Price fluctuations lead to a deviation between spot and final profits | Trading Profit/Risk Compliance |
| Trade 2 | Information Gap and Shrinking Relationship-Based Profits | Customer Service/Data AI |
| Trade 3 | Mismatch between supply and demand and difficulty in judging the inventory cycle | Resource Control Tower / Trading Profit |
| Trade 4 | Complex contract execution eats up business profits | Trading Profit / Customer Service |
| Trade 5 | Quantity and quality dispute | Customer Service / Risk Compliance |
| Trade 6 | Counterparty credit concentration | Risk Compliance / Trade Finance |
| Trade 7 | Sanctions/Anti-Money Laundering/Trade Compliance Complexity | Risk Compliance / Data AI |
| Trade 8 | Complex cross-regional tax, customs, and origin issues | Risk Compliance/Trading Profit |
| Trade 9 | Data fragmentation makes it impossible to see the real profit | Trading Profit/Data AI |
| Trade 10 | Talent Authorization and Incentives Do Not Match | Organizational Governance/Trading Profit |
| Maritime 1 | Uncertain shipping schedule and changes in fuel supply plans | Resource Control Tower |
| Maritime 2 | Dispute over fuel delivery quantity | Customer Service/Data AI |
| Maritime 3 | Oil Quality and Compatibility Risk | Customer Service / Risk Compliance |
| Maritime 4 | The chain of evidence for sampling inspection is incomplete | Customer Service/Data AI |
| Maritime 5 | Standards for multiple port supplies are not uniform | Customer Service / Organizational Governance |
| Maritime 6 | Price-sensitive, low profit margin, long payment terms | Trading Profit / Commodity Financing |
| Maritime 7 | Alternative fuel route is uncertain | Resource Control Tower / Risk Compliance |
| Maritime 8 | The cumulative costs of carbon regulations are difficult to calculate | Risk Compliance/Trading Profit |
| Maritime 9 | High on-site safety and environmental risks | Risk Compliance / Resource Control Tower |
| Maritime 10 | Insufficient integration of comprehensive service systems | Customer Service/Data AI |
| Logistics Finance 1 | Logistics resources are scattered and lack end-to-end visibility | Resource Control Tower / Data AI |
| Logistics Finance 2 | Difficult to coordinate transport capacity and tank cargo volume | Resource Control Tower |
| Logistics Finance 3 | Freight rates and demurrage fluctuations erode profits | Trading Profit / Resource Control Tower |
| Logistics Finance 4 | Compliance of Multimodal Transport of Hazardous Chemicals | Risk Compliance / Customer Service |
| Logistics Finance 5 | Inventory takes up funds but the safety stock cannot be canceled | Trading Profit / Resource Control Tower |
| Logistics Finance 6 | Insufficient financing quota and mismatched fluctuations | Cargo Ownership Financing / Risk Compliance |
| Logistics Finance 7 | Financing costs cannot be allocated to a single transaction | Trading Profit / Commodity Financing |
| Logistics Finance 8 | Risks of warehouse receipt and bill of lading | Cargo Ownership Financing / Risk Compliance |
| Logistics Finance 9 | Credit Market Liquidity Risk Resonance | Risk Compliance / Trade Finance |
| Logistics Finance 10 | Cross-border settlement exchange rate bank compliance uncertainty | Cargo Ownership Financing / Risk Compliance |
3. Common Root Cause: Why Single-Point Optimization Cannot Solve It

| Root Cause 1|No Common Business Object Contract numbers, batches, tank numbers, vessels, warehouse receipts, letters of credit, and hedging positions cannot be stably linked, resulting in multiple versions of the same shipment. |
|---|
| Root Cause 2|Profit Time Boundary Error Assessment stops at contract signing or invoice gross profit, while demurrage, claims, financing, exchange rates, ECL, carbon, and capital occupation appear only months later. |
|---|
| Root Cause 3|Conflicting Departmental Objective Functions Trade pursues transactions and gross profit, logistics pursues timeliness, finance pursues liquidity, risk pursues limits, and customers need complete fulfillment, but there is a lack of common metrics. |
|---|
| Root Cause 4 | Static Limits Replace Dynamic Risk Client, country, commodity, and bank limits do not interact with prices, collateral rates, margins, shipping schedules, and payment collection. |
|---|
| Root Cause 5 | Services Are Not Productized: Maritime energy, logistics, quality, carbon, and financial services are pieced together by projects, lacking unified SLAs, data interfaces, and customer responsibilities. |
|---|
| Root Cause 6|Post-Transaction Compliance Sanctions, AML, hazardous materials, taxes and customs, origin, and carbon rules are only reviewed when the transaction is close to execution, leading to the structure being unadjustable. |
|---|
4. Overall Architecture of the Integrated Solution
One main business line, six capability domains, three operational loops
The source-document visual is presented here as an English-native analytical frame. The adjacent English narrative and tables preserve the full evidence and quantitative context.
The responsibility boundaries of the six competency areas
| Competency domain | The core issue to be resolved | Key output |
|---|---|---|
| Transaction Profit Center | Spot gross profit diverges from final profit | Quoted profit, risk-adjusted accruals, final cash profit, RAROC |
| Resource Control Tower | Mismatch of goods, ships, ports, tanks, vehicles, pipelines, and customer interfaces | Probability ETA, capacity conflict, rescheduling plan, complete delivery commitment |
| Risk Compliance Engine | Market, credit, sanctions, hazardous chemicals, carbon, and HSE dispersed | Dynamic quotas, rule-based access control, joint pressure, action triggers |
| Cargo Rights Financing Center | Separation of goods ownership documents, collateral, credit limit, and cash | Qualified mortgage, dynamic financing capacity, 13-week cash, controlled release |
| Customer Service Middle Platform | Quotation, quality, evidence, and comprehensive services are inconsistent | Unified orders/SLA, evidence package, dispute management, customer segmentation |
| Data and AI Platform | Multiple versions of data, anomalies rely on manual handling, models are uncontrollable | Master Data, Event Ledger, Knowledge Base, Predictive Optimization, and Model Governance |
5. Main Line of Single Transaction Operations: From Quotation to Final Settlement
Main Digital Transaction Line and Business Elements That Must Be Updated at Each Stage
The source-document visual is presented here as an English-native analytical frame. The adjacent English narrative and tables preserve the full evidence and quantitative context.
Seven Business Checkpoints
Opportunities/Quotes: Calculate scenario ranges for goods, logistics, quality, financing, exchange rates, credit, customs, carbon, and capital costs.
Contracts: Mirror responsibilities for procurement, sales, chartering, storage, financing, and hedging terms, and identify risks that cannot be transferred.
Procurement and hedging: Confirm the basis, quantity, timing, currency, and margin liquidity, and do not equate accounting hedges with cash security.
Logistics execution: Rolling scheduling based on probabilistic ETA and resource constraints, with anomalies automatically showing incremental costs and customer impact.
Ownership of goods and financing: verify the authenticity of goods, controllable ownership, sole pledge, qualified warehouse, and release rights.
Delivery and Settlement: Quantity, quality, sampling, SOF, NOR, BDN, warehouse receipt/bill of lading, and payment evidence enter the same file.
Final review: During account closing, aggregate demurrage, claims, financing, exchange rates, ECL, taxes, and capital occupancy, and update customer/supplier ratings.
| Profit Formula: Risk-Adjusted Trading Profit = Total Trading Revenue - Cost of Goods - Logistics/Quality Costs - Financing/Exchange Rate Costs - Expected Credit Loss - Compliance/Carbon Costs - Capital Requirement. |
|---|
6. Representative Comprehensive Case: How Profit Leakage Occurs
Profit bridge of the anonymized business portfolio from book contribution to final cash contribution
The source-document visual is presented here as an English-native analytical frame. The adjacent English narrative and tables preserve the full evidence and quantitative context.
| Profit hierarchy | Amount (million USD/year) | Management Explanation |
|---|---|---|
| Contracted Book Contribution | 74.0 | Procurement and sales price difference, initial service fee |
| Execution and Risk Mitigation | -25.6 | Logistics demurrage, quantity and quality, financing exchange rates, credit, compliance, carbon HSE, and mismatching |
| Final cash contribution | 48.4 | Results after completing repayments, claims, taxes, and capital costs |
| Integrated Scheme Steady-State Recovery | John 14:1 | Achieving through avoidance, transfer, recovery, optimization, and capital efficiency does not equal accounting income |
Case Assessment: 34.6% of the book contribution is eroded over the full transaction cycle. If the business team still evaluates it at $74.0 million, the organization will continue to reward expanding exposure; the comprehensive plan uses $48.4 million as the factual baseline and allocates $14.1 million of verifiable recovery to responsible individuals and events.
7. Scenario One: The Integrated Closed Loop of Oil and Gas Trade
Representative scenario
A single transaction of 50,000 tons of diesel across regions: at the time of signing, the price difference was $32/ton, and then port loading was delayed, storage capacity at the destination port was insufficient, the client's payment period was extended, prices fell, and hedging margin requirements occurred simultaneously. Traditional systems separately show 'sales profit, logistics delay, financial gap, risk limit exceeded,' yet they cannot answer whether to change the port, resell, postpone, or add hedging.
Comprehensive disposal
The control tower calculates three executable options: continue fulfilling the contract, change the port to resell, or delay delivery and add inventory hedging.
The trading profit center shows the cash profit, tail loss, and capital allocation of each plan, not just comparing the spot price difference.
The risk engine conducts linked stress tests on clients, ports, commodities, banks, and margins, triggering limit and advance payment adjustments.
The contract engine confirms whether the responsibilities for demurrage, quantity, quality, and force majeure can be transmitted, and the legal department reviews the evidence.
The final selection must be approved by the authorized person, and the system records assumptions, selections, results, and model biases.
| Decision plan | Expected cash profit | Liquidity peak on the 30th | Key Risk |
|---|---|---|---|
| Continue with the original plan | $480,000 | $11.5 million | Tank capacity/detention and customer's delay |
| Modify for Hong Kong resale | $620,000 | 7.6 million US dollars | Change port charges and replace the buyer |
| Delay and hedge | $550,000 | $13.2 million | Margin and Basis |
8. Scenario Two: Maritime Energy and Integrated Services
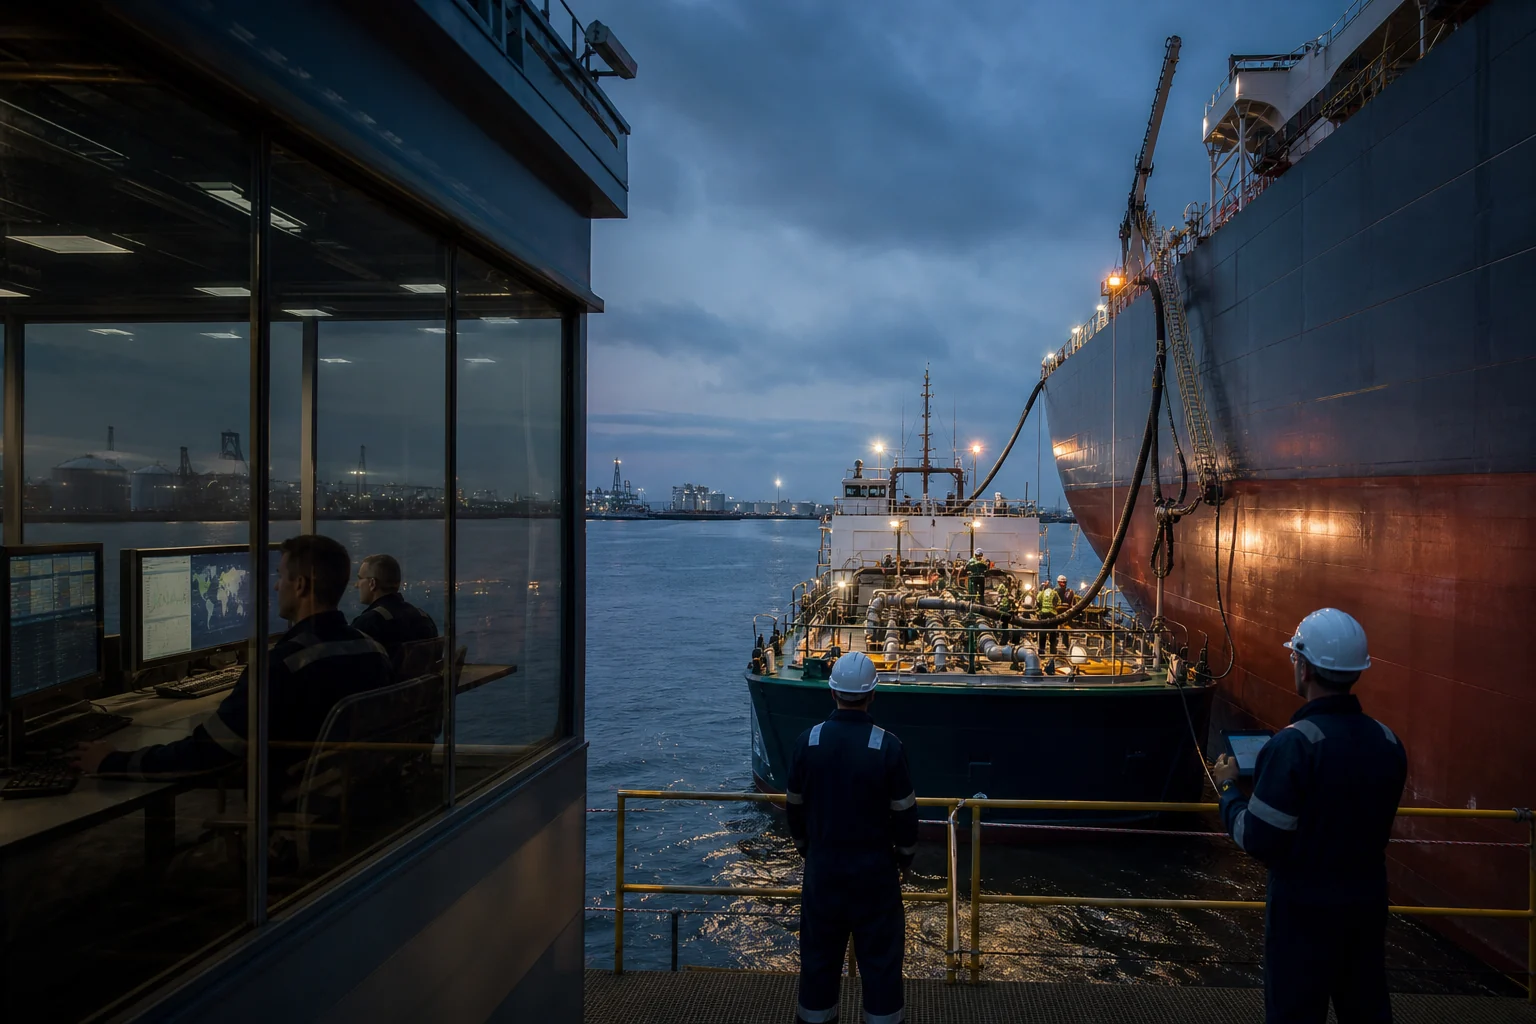
Representative scenario
An international route vessel requires 1,800 tons of VLSFO supply and requests lubricating oil, inspection, carbon data, and agency services. The ETA keeps being postponed, onboard residual oil compatibility is unclear, there are differences between MFM and tank measurement, and the voyage involves costs related to EU ETS and FuelEU.
Comprehensive disposal
Use probabilistic ETA to link barges, inventory, tides, docks, and crews, and identify port changes and waiting costs in advance.
The quality module reads the COQ, residual oil questionnaire, and historical batches to decide on trial mixing, compartmentalization, temperature control, and switching plans.
The quantity module unifies MFM calibration, zero point, event log, tank table, temperature and density conversion, and ROB evidence.
The digital evidence chain links sampling points, seals, signatures, handovers, testing methods, and reports with the BDN.
The carbon rules engine calculates costs based on the applicable year, voyage scope, and fuel certificates, and factors them into customer quotations and contractual obligations.
HSE adopts key barrier verification and the right to stop work; no efficiency target should override safety access control.
| Complete service indicators: the proportion of voyages that are on time, of sufficient quantity, qualified, with complete evidence, accident-free, with explainable carbon costs, and meeting final cash gross profit targets. |
|---|
9. Scenario Three: Logistics, Cargo Ownership, and Trade Finance

Representative scenario
A batch of $25 million worth of chemical products is delivered through pipelines, shore tanks, sea transport, storage, and tank trucks, with financing supported by inventory and warehouse receipts. Prices dropped by 20%, customers deferred for 60 days, and defects were found in the issuance authority of the warehouse receipts and the endorsement of the paper bills of lading.
Comprehensive disposal
Each batch of goods has a unique asset ID, associated with the tank number, quantity, quality, warehouse receipt/bill of lading, pledge, movement, and release status.
Independent storage and inspection bodies verify physical items, and pledge registration checks existing rights; electronic documents must verify identity, authority, uniqueness, and legal validity.
Dynamic financing capacity is calculated based on price, quantity, prudential discounts, priority, and disposal costs, and does not finance according to nominal value.
The 13-week cash flow model synchronizes client deferrals, letters of credit, taxes, deposits, bank quotas, and cross-border payment paths.
The release of goods uses financing parties' controllable instructions, dual approval, and minimum collateral coverage thresholds; in abnormal situations, it is immediately frozen.
| Key Result: The nominal value of goods does not equal eligible collateral. Only when the goods are real, priorities are clear, documents are valid, release is controllable, and disposal is enforceable can they qualify for financing capacity. |
|---|
10. Data and AI: Upgrading from Dashboards to Executable Decisions
Data Base
| Data field | Minimum required object | Quality Control |
|---|---|---|
| Transactions and Contracts | Transaction ID, Counterparty, Category, Quantity, Price, Terms, Responsibility | Version, approval, clause mirror, master data uniqueness |
| Physical goods and logistics | Batch, tank, vessel, port, truck, pipeline, ETA, event | Timestamp, source, checksum, confidence |
| Quality and Evidence | Specifications, COQ, samples, seals, testing, quantity measurement | Method Version, Custody Chain, Signature and Non-repudiation |
| Risk Compliance | Credit, Market, Sanctions, AML, Hazardous Chemicals, Carbon, HSE | Rule version, hit explanation, manual review |
| Capital and property rights | Invoice, letter of credit, warehouse receipt, bill of lading, pledge, payment, hedging | Uniqueness, priority, reconciliation, release of goods, and cash matching |
| Financial Performance | Accrued, actual expenses, ECL, capital, tax, final profit | Transaction-level collection, account closing status, auditable adjustments |
AI Application List
Document Intelligence: Extract contracts, SDS, warehouse receipts, bills of lading, SOF, NOR, BDN, and bank messages, and automatically cross-verify.
Forecast: probability ETA, demand, inventory, freight rates, payment collection, quality compatibility, and liquidity peaks.
Optimization: coordination of cargo ships and port tanks, loading assignment, port modification, inventory, and combination of financing tools.
Anomaly Detection: duplicate pledges, conflicts between ownership/physical goods, MFM curve anomalies, sanction associations, profit deviations.
Knowledge assistance: retrieval of regulations, contracts, claims, and on-site SOPs, outputting the basis and confidence level.
| AI Control Boundaries: Model outputs must display data sources, time, assumptions, and confidence levels. High-impact decisions such as trading, credit, compliance, release of goods, payments, withdrawals, and HSE work stoppage and resumption must retain human authorization and be fully traceable. |
|---|
11. Joint Risk and Compliance Control
The procyclical risk loop formed by prices, credit, mortgages, limits, and margins
The source-document visual is presented here as an English-native analytical frame. The adjacent English narrative and tables preserve the full evidence and quantitative context.
Risks that must be managed in a consolidated manner
Commodity prices and basis risk simultaneously change inventory value, customer willingness to perform, and financing collateral rates.
Derivatives reduce accounting price risk, but they may create a margin cash gap before the spot collection.
Sanctions, AML, bank de-risking, and changes in correspondent banks will turn compliance events into liquidity events.
Hazardous materials, gaps in quantity, quality, and evidence chain can simultaneously cause cargo detention, insurance claim denial, claim failure, and criminal liability risk.
Carbon regulations and alternative fuel choices will change the total cost of fuel, customer demand, and infrastructure value.
Joint Stress Test
| Situation | Combined Impact | Action trigger |
|---|---|---|
| Price drop | Commodity/Chemical prices -25%, basis widened, inventory discount | Stop speculative inventory, increase prepayments, reduce positions and review hedging |
| Credit deterioration | Among the top ten clients, two delayed for 60 days, and one defaulted | Freeze new additions, credit enhancement, accounts receivable insurance/factoring, and collections |
| credit contraction | Bank limit -20%, mortgage rate reduced, margin $8 million | Backup credit line, asset disposal, currency allocation, transaction limit compression |
| Operational Interruption | Key ports closed for 7 days, shipping routes detoured, freight rates up 30% | Change port, alternative supply, customer re-commitment, contract notice |
| Compliance incident | Ship/Payment chain hit, hazardous chemical documents inconsistent | Immediately suspend, independently review, prohibit circumvention and structural avoidance |
12. Organization, Authorization, and Incentive Mechanism
| Character | Core responsibility | Key authorization |
|---|---|---|
| Trading Manager | Responsible for business logic and final cash profit | Quote and close deals within risk budget, credit, and profit bottom line |
| End-to-End Trade Manager | Promote single-order business across contracts, logistics, quality, and funds | Invoke pre-approved exception scenario and escalate cross-departmental conflict |
| Resource Control Tower | Ship Port Tanker Pipeline Planning and Abnormal Rescheduling | Recommended plan, without bypassing commercial/security/compliance approvals |
| Finance and Ownership of Goods | Credit limit, cash, hedging, collateral, and release of goods | Withdrawals, hedging, and controlled release according to policy |
| Risk Compliance | Dynamic limits, joint stress, rule access control, and model validation | Independent Veto and Escalation of Major Risks |
| Financial control | Transaction Accrual, Final Settlement, and Performance Caliber | Closing Adjustments, Profit Attribution, and Data Quality Accountability |
| Data/AI Governance Committee | Data ownership, model boundaries, and monitoring | Approve model usage, thresholds, versions, and deactivation |
Performance mechanism
Transaction bonuses are based on 'accrued contract profit + final settlement realization', attributing losses to demurrage, claims, credit, funds, and compliance.
Common indicators include at least final cash profit, risk-adjusted return on capital, complete delivery, cash conversion, and major compliance/HSE incidents.
An individual must not simultaneously have the complete permission chain for initiating transactions, risk approval, releasing goods, and making payments.
Provide positive incentives for proactively stopping unsafe operations, timely reporting of risks, and avoiding tail-end losses.
13. Implementation Roadmap
18-Month Phased Implementation Roadmap
The source-document visual is presented here as an English-native analytical frame. The adjacent English narrative and tables preserve the full evidence and quantitative context.
First batch of pilot recommendations
Select a cross-border refined oil route, a type of marine fuel service, and an inventory financing scenario.
The pilot must cover trading, logistics/operations, treasury, risk compliance, and finance simultaneously, to avoid becoming a system for a single department.
Establish financial baselines, abnormal samples, and control evidence for each link, and accept them based on cash value and risk outcomes.
Any expansion must meet five thresholds: data quality, user adoption, effective control, model stability, and value realization.
14. Value Assessment and Business Justification
Steady-state Annual Value Pool and Investment Payback Assessment
The source-document visual is presented here as an English-native analytical frame. The adjacent English narrative and tables preserve the full evidence and quantitative context.
| Value pool | Steady-state value (million USD/year) | Verification method |
|---|---|---|
| Logistics, demurrage, expediting, and resource coordination | 4.2 | Compare actual costs and avoided costs with voyage/ticket cargo baseline |
| Quantity, quality, evidence, and claims | 2.0 | Recovered claims, dispute rate, and loss rate |
| Financing, Exchange Rates, and Cash Management | 3.1 | Transaction-level funding costs, margin peaks, and payment success rate |
| Inventory and Resource Optimization | 2.4 | Total holding cost, stockout rate, inventory age, and option value |
| Credit, Compliance, and Ownership Risks | 2.4 | Expected loss changes, interception events, and qualified collateral coverage |
| Total | 14.1 | Stable annual verifiable value, excluding hard-to-verify brand benefits |
| Investment Judgment: It is recommended to invest approximately $7.8 million in an 18-month project, including data interfaces, process and control design, platform, models, change management, and independent verification. The investment will be phased and ramped up, deducting ongoing operational costs, with a conservative estimate of recovery in 12–18 months; each benefit must be confirmed by financial control. |
|---|
Discipline of Value Realization
Establish a value baseline and freeze the calculation formula to avoid selective attribution afterwards.
Avoid separately disclosing costs, cash recovery, and capital release, and do not double count.
Revenue is only included in the project value after final settlement or confirmation by the risk committee.
Regulatory compliance and major accident prevention should be managed through threshold management, rather than denying necessary controls based on short-term ROI.
15. Management Dashboard: Top Ten Key Metrics
| Indicator | Definition/Purpose | 18-month goal |
|---|---|---|
| Risk-adjusted trading profit | Final cash profit after deducting ECL and capital requirements | Improve by 18%–25% compared to the baseline |
| Risk-Adjusted Return on Capital (RAROC) | Risk-adjusted profit / allocated capital | Above the group's capital threshold |
| Unhedged Exposure and Margin Gap | Simultaneous monitoring of price and cash exposure | Within policy and 30-day coverage ≥ 1.2 times |
| Concentration of Top 10 Customers | Credit exposure rather than just accounts receivable balance | Decrease by 20% or complete credit enhancement |
| Financing Amount and Term Structure | Available capacity and maturity gradient under price pressure | Peak coverage ≥ 1.2 times |
| The proportion of inventory controlled by the ownership of goods | Physical goods, rights, pledges, and release of goods are all valid | ≥99% |
| Accounts Receivable Cash Conversion | DSO, overdue, and first payment success | DSO decreased by 20% |
| Logistics deviations and demurrage risks | ETA, waiting for berth, ship-to-ship transfer, urgent, and demurrage | Total cost decreased by 15%–25% |
| Ship Fuel Complete Delivery Rate | On time, sufficient, qualified, safe, and with complete evidence | ≥96% |
| Proportion of comprehensive service customer wallet | The coverage extent of services related to customer procurement | Key clients increased by 15% |
16. Project Risks, Boundaries, and Success Criteria
| Risk | Platform first, processes lagging: First determine business entities, responsibilities, and controls, then configure the system; do not replace operational transformation with dashboard launch. |
|---|
| Risk | Data is unreliable Each data point retains its source, time, responsible person, and confidence level; key financial, ownership, and compliance facts must be auditable. |
|---|
| Risk | Value double counting Unified baseline and attribution controlled by finance, with separate accounting for cash recovery, cost avoidance, and capital release. |
|---|
| Risk | AI overreach: Use purpose approval, model validation, threshold monitoring, manual takeover, and deactivation mechanisms; high-impact actions are prohibited from automatic execution. |
|---|
| Risk|Regional Regulatory Differences The rules engine is versioned by country, port, product, mode of transport, and effective date, issued by local experts. |
|---|
| Success Conditions|Joint Responsibility of Management Business, operations, treasury, risk, compliance, and finance jointly serve as project initiators to resolve goal conflicts with shared metrics. |
|---|
Case Scope and Limitations
The scale, transaction volume, rates, losses, value pools, investments, and targets in the report are anonymized professional scenarios constructed based on the logic of the oil and gas trading industry. They are used to demonstrate integrated solutions and do not represent the facts, audit conclusions, legal opinions, regulatory interpretations, or investment commitments of any specific enterprise described in the user documents. Before implementation, they must be recalibrated using real contracts, historical transactions, banking terms, applicable laws, technical standards, and audited financial data.
Seventeen, Conclusion and References
| Final Recommendation: Centered on the 'Truth of Single Transaction Management,' integrate the 30 pain points of the three major sectors into six shared capability domains. In the first phase, stop the large-scale leakage of profits, ownership rights, compliance, and liquidity; in the second phase, connect trade execution with final settlement; in the third phase, use AI and optimization models to enhance scaled operations. The project's success standard is not how many modules are launched, but whether final cash profits, capital returns, complete delivery, and tail risks are continuously improved. |
|---|
Authoritative reference caliber
Asian Development Bank (ADB), 2025 Global Trade Finance Gap Survey: The global trade finance gap is about $2.5 trillion, approximately 10% of global trade. https://www.adb.org/publications/adb-global-trade-finance-gap-survey
International Chamber of Commerce Digital Standards Initiative (ICC DSI): Global trade still mainly relies on more than 40 types of official and commercial documents, and digitalization needs to address standards and legal recognition. https://dsi.iccwbo.org/
International Maritime Organization (IMO), 2023 IMO GHG Strategy: International shipping to achieve net zero around 2050, with indicative checkpoints in 2030/2040. https://www.imo.org/en/OurWork/Environment/Pages/2023-IMO-Strategy-on-Reduction-of-GHG-Emissions-from-Ships.aspx
European Commission, FuelEU Maritime: Regulations fully applicable from January 1, 2025 (monitoring plan provisions applicable from August 2024). https://transport.ec.europa.eu/transport-modes/maritime/decarbonising-maritime-transport-fueleu-maritime_en
European Commission, EU ETS Maritime FAQ: Phased increase in compliance rate for shipping emission allowances. https://climate.ec.europa.eu/eu-action/transport-decarbonisation/reducing-emissions-shipping-sector/faq-maritime-transport-eu-emissions-trading-system-ets_en
International Maritime Organization (IMO), IMDG Code 2024 Edition / Amendment 42-24: Regulations for the Carriage of Dangerous Goods by Sea. https://www.imo.org/en/publications/pages/imdg code.aspx
United Nations Economic Commission for Europe (UNECE), Dangerous Goods: ADR/RID and other dangerous goods transport frameworks. https://unece.org/transport/dangerous-goods
Reference document: Comprehensive Problem-Solving Solution.docx (provided by the user, SHA-256: B22D46C4…DC28A7). The original file remains unchanged.